Staff Salaries
June 2019 - Results
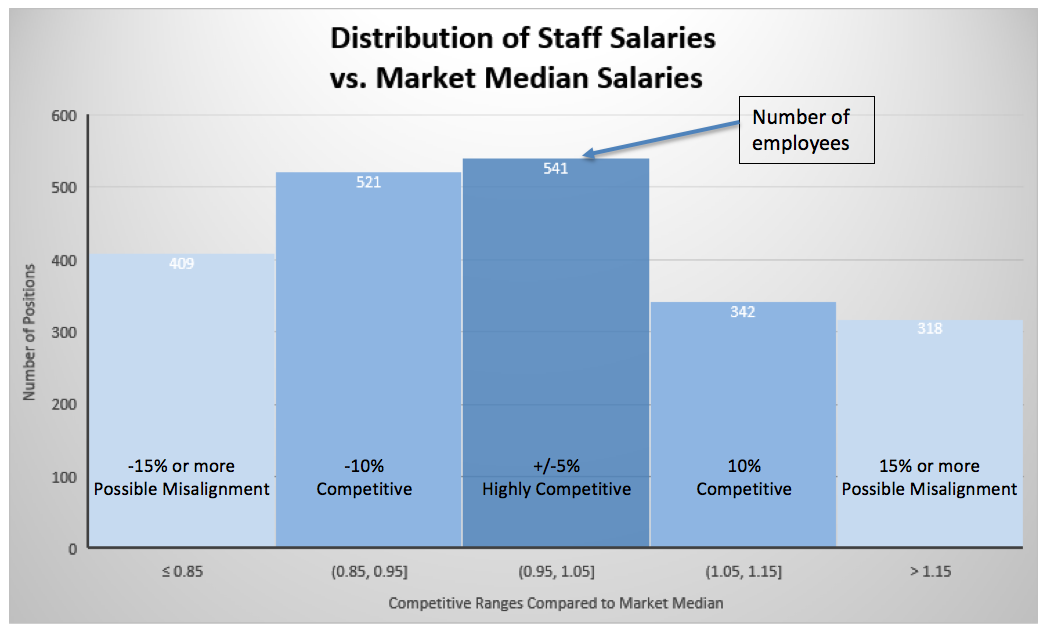
Across the system staff salaries are, on average, -7% of the market median by classification. Broken down by the institution the results are as follows:
- UAA: -10% of market median
- UAF: - 5% of market median
- UAS: -4% of market median
- SW: -7% of market median
Where we are:
- Benchmarking for 80% of staff positions (~2,100) in relation to the national market is complete
What we know:
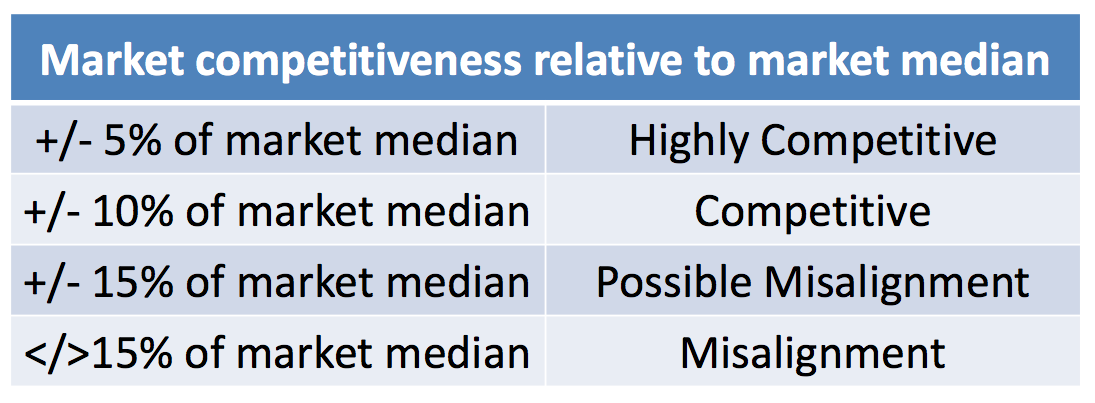
- Overall, staff salaries are highly competitive in relation to market median (-2.7%)
Next steps:
- Review specific positions that are misaligned in relation to the market
- Review hard-to-fill or unique positions
- Review the salary structure needed to include the remaining 20% of positions
- Review/align the job families in relation to the current market
Methodology and Survey Sources
UA worked with Lockton to review current job families, salary structure information, organizational hierarchy, and staff reports to provide insight into job and organization structure
Salary data were collected from the following education-specific surveys, using national data cuts to ensure the most comprehensive data set:
- CompData Colleges and Universities Survey
- CUPA-HR Staff in Higher Education Survey
- CUPA-HR Professionals in Higher Education Survey
- Western Management EduComp Survey
The 3% annual adjustment (aging) was applied to each survey source
Staff Salary FAQ
The university’s goal, over time, is for all employees to be paid within a consistent salary structure. Going forward, compensation guidelines will be established and followed. Salaries will not be reduced as a result of this project.
The salary structure will be based on ranges, which will be applied to all current and future UA positions. The ranges will account for differing skill levels and experience. The compensation structure will be a simple, easy to understand framework to ensure appropriate, competitive, and equitable salaries, and allow for flexibility, when appropriate.